01
See the portfolio.
Connect ventures, sectors and cohorts in one considered view. Move from the bigger picture to the records behind it.
Independent intelligence. A wider perspective.
Understand creative ventures, investment and employment through clear, connected intelligence.

Inside the platform
Data cutoff: · USD
120
2 cohorts · 2025 and 2026
The distinct startups matching your selected cohort, sector and search filters.
Calculation and limitations$5,451,207.00
Received: $2,447,191.65
The amount promised in recorded commitments, distinct from money received.
Calculation and limitations802
102/120 current observations
The latest recorded employment headcount after cohort start and on or before the data cutoff.
Calculation and limitations95
90/120 matched observations only
The change between baseline and current headcount where both observations exist.
Calculation and limitationsSynthetic commitments and receipts · USD
Only months with recorded financial events are shown; gaps between months are not a continuous timeline.
| Month | Committed | Received |
|---|---|---|
| 2025-02 | $537,599.00 | $0.00 |
| 2025-03 | $291,320.00 | $97,651.50 |
| 2025-04 | $412,747.00 | $58,099.25 |
| 2025-05 | $459,663.00 | $184,525.70 |
| 2025-06 | $557,561.00 | $326,873.25 |
| 2025-07 | $145,265.00 | $267,693.20 |
| 2025-08 | $408,407.00 | $115,575.05 |
| 2025-09 | $0.00 | $163,367.00 |
| 2025-10 | $0.00 | $58,562.70 |
| 2025-11 | $0.00 | $15,085.60 |
| 2026-02 | $455,253.00 | $0.00 |
| 2026-03 | $395,829.00 | $94,517.00 |
| 2026-04 | $407,499.00 | $68,908.25 |
| 2026-05 | $348,571.00 | $101,540.90 |
| 2026-06 | $139,791.00 | $254,099.25 |
| 2026-07 | $549,860.00 | $137,692.15 |
| 2026-08 | $341,842.00 | $210,057.05 |
| 2026-09 | $0.00 | $181,131.85 |
| 2026-10 | $0.00 | $111,811.95 |
Games · 2026
$57,447.00 committed
Music · 2026
$53,803.00 committed
Design · 2026
$99,469.00 committed
Incomplete employment coverage: 14 missing baselines; 18 missing current snapshots. Missing data is never zero. All records are fictional; these are not Ghana creative economy statistics.
Clarity, from the ground up
Bring the portfolio into focus without losing the detail. From a single venture to a cohort comparison, every number has a definition and a boundary.
Connect ventures, sectors and cohorts in one considered view. Move from the bigger picture to the records behind it.
Separate investment commitments from actual receipts. Explore financial events with explicit dates and clear definitions.
Compare cohorts and employment observations with visible coverage. Know what is reported, and what is still missing.
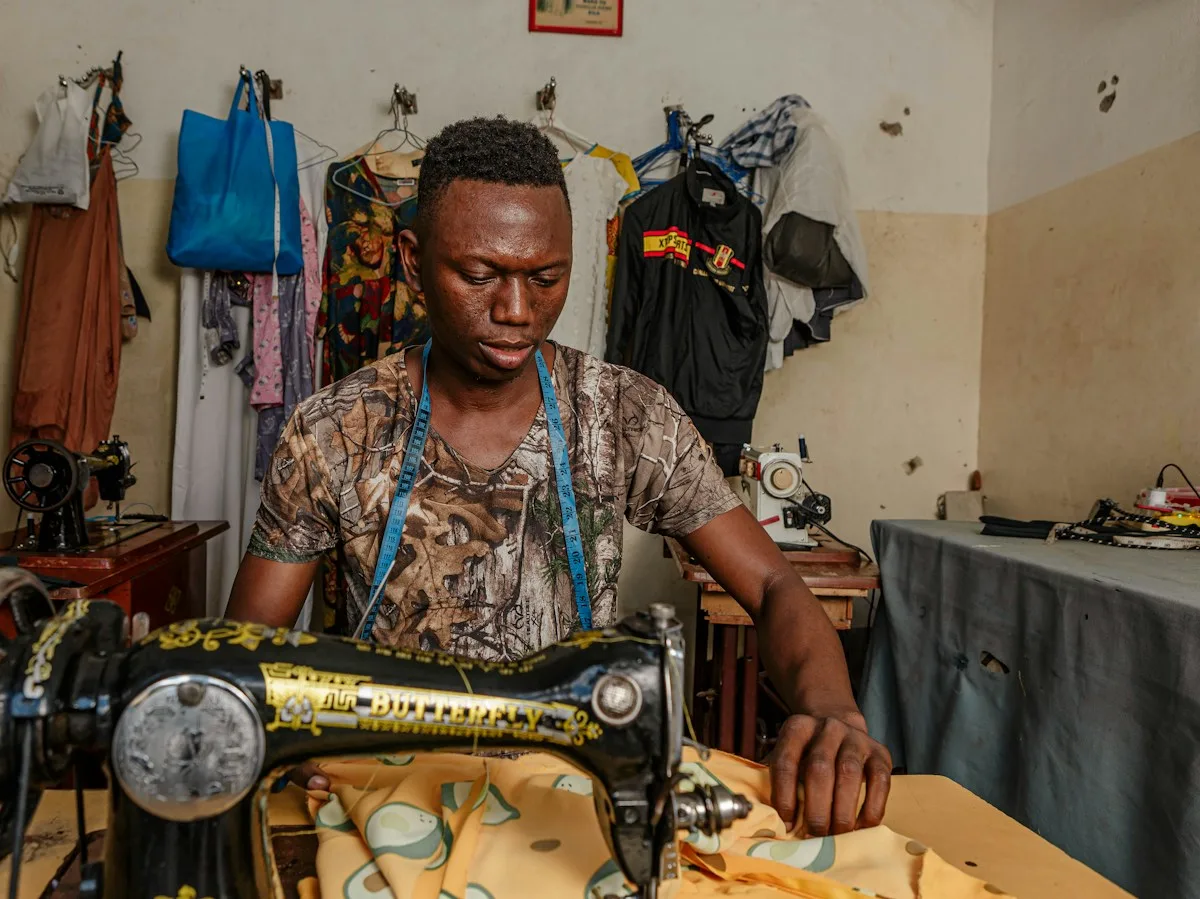
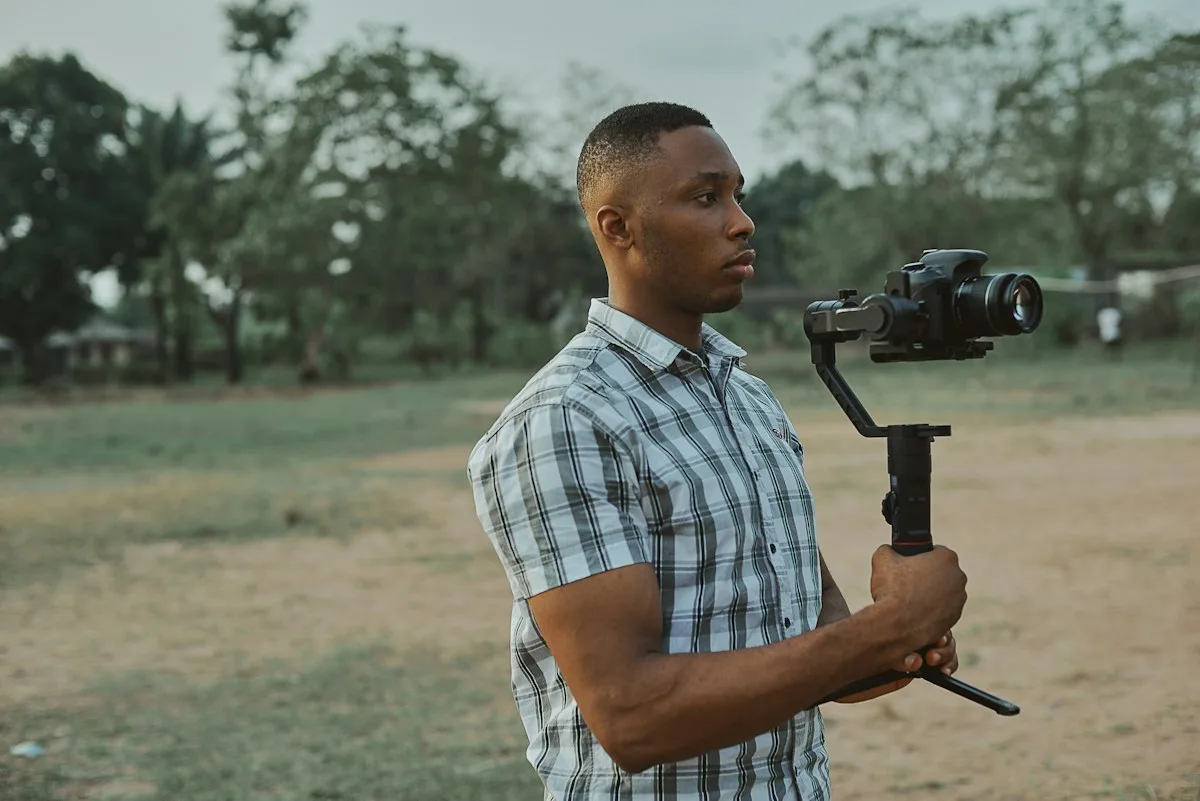

Temporary development photography from Unsplash. Subjects are not presented as EWG participants or platform beneficiaries; photographs are unrelated to the synthetic portfolio data.
Keep the context when you share. Export filtered records with synthetic labels and missing data intact.
Explore reportingBuilt for shared understanding
A shared view of ventures, cohorts and the progress you can actually observe.
Portfolio context and a clearer distinction between committed and received capital.
A common language for understanding the programmes and ventures you support.
Explicit definitions, coverage indicators and exportable observations to inform further enquiry.
An initial use case
Creative Economy Intelligence is an independent platform developed by Ridtech Labs. Entertainment Week Ghana’s Deal Room is an initial example of the programme context it can support.
Bring structure to how ventures, capital and employment observations are understood across a programme. The demonstration uses invented cohorts and ventures, not EWG participant records.
An illustrative application for creative-industry programmes. All demonstration records are fictional and do not represent actual EWG participants or outcomes.
A perspective worth exploring
Explore a fictional portfolio. No account required for the explicitly configured demonstration.